How it Works
MammoScreen® is an award winning AI-based software that integrates seamlessly with your existing workflow. MammoScreen offers worklist management, case precheck, lesion assessment with 2D, 3D, and priors, density, management recommendations, and pre-reporting.
A comprehensive AI
- Intuitive, actionable score
- 2D, 3D, and Priors combined in a single score
- Cloud-based or on-premise installation available
Far more than just a detection tool, MammoScreen assists radiologists at every key stage of the mammogram reading process:
- Automated image quality evaluation
- Density assessment
- Pre-reporting
- Cancer risk prediction
A trusted software
- Adopted by the majority of radiologists using AI in screening in France
- Used by world-leading institutions and women-imaging networks in the US
- The software is CE-marked in Europe and has FDA clearance in the United States.*
Read below to learn more about all of its benefits.
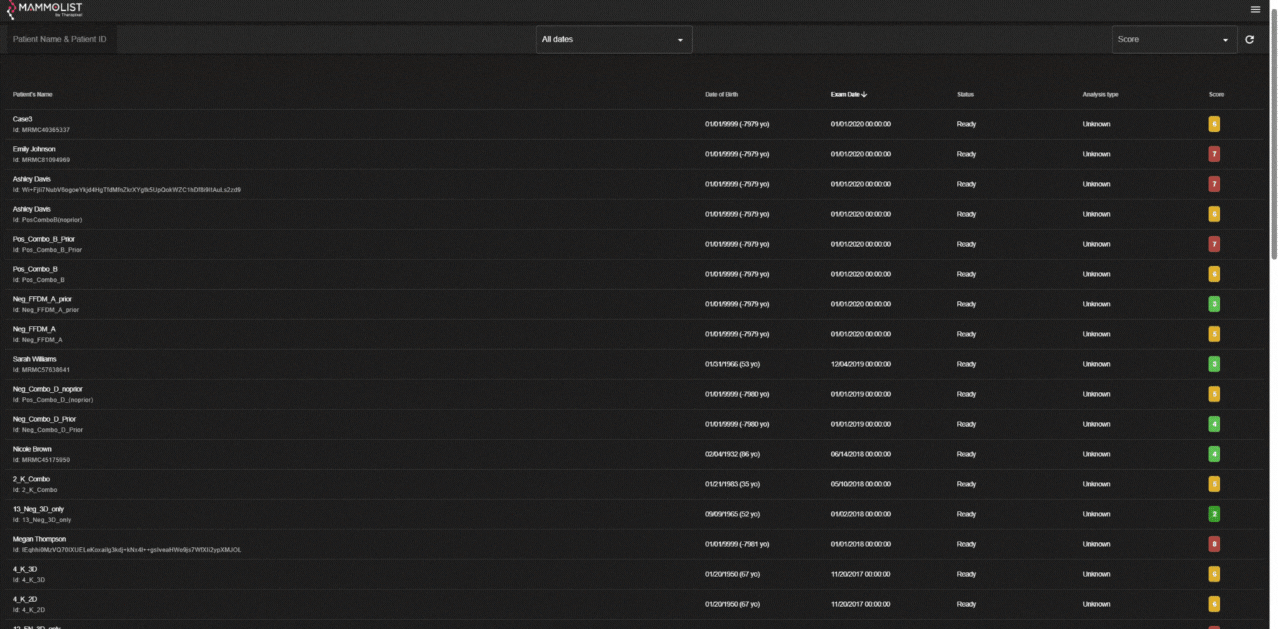
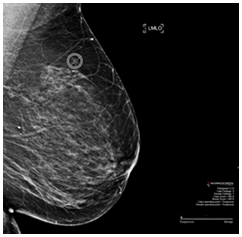
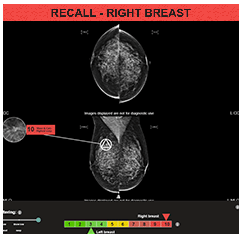
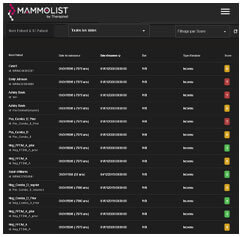
The MammoScreen Score™
Unique. Insightful. Actionable.
We provide a score for:
✓ Each finding ✓ Each breast ✓ Overall case
This easy-to-read and easy-to-understand approach will help you with evaluation of cases.
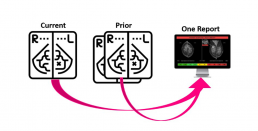
The Power of Priors!
We pioneered the incorporation of a prior into our software’s consideration for enhanced performances.
Information about on-premises installation available upon request.
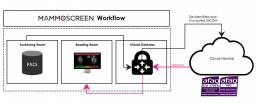
MammoScreen Workflow
Our vendor-neutral, zero-click workflow can be incorporated into your workflow with ease. For IT professionals, this is one of the simplest installations they will ever experience.
For radiologists, the work is all done behind the scenes, so
when you’re ready to read, MammoScreen is there for you!